Yara: Statusboard
This project is revived by me after it was finished for a university course. It felt like a good idea to bring our outcome to a more final looking product. However, the design process is different than in typical design studies, so it kinda lacks in user research. Therefore, it can only be seen as a concept for a non-existing scenario in a serious background. This project will focus on the discovery, procedures, and visualization of fire on an autonomous ship, specifically Yara Birkeland. Our partners in this project have mainly been Telenor and Yara. We looked into processes of occurring fire occurring, the processes of information, and the data flow associated with three levels of autonomy. This information is brought together into a clickable prototype.
Experts in Teamwork
4 month
Figma, Miro
The Project
This project is revived by me after it was finished for a university course. It felt like a good idea to bring our outcome to a more final looking product. However, the design process is different than in typical design studies, so it kinda lacks in user research. Therefore, it can only be seen as a concept for a non-existing scenario in a serious background. This project will focus on the discovery, procedures, and visualization of fire on an autonomous ship, specifically Yara Birkeland. Our partners in this project have mainly been Telenor and Yara. We looked into processes of occurring fire occurring, the processes of information, and the data flow associated with three levels of autonomy. This information is brought together into a clickable prototype.
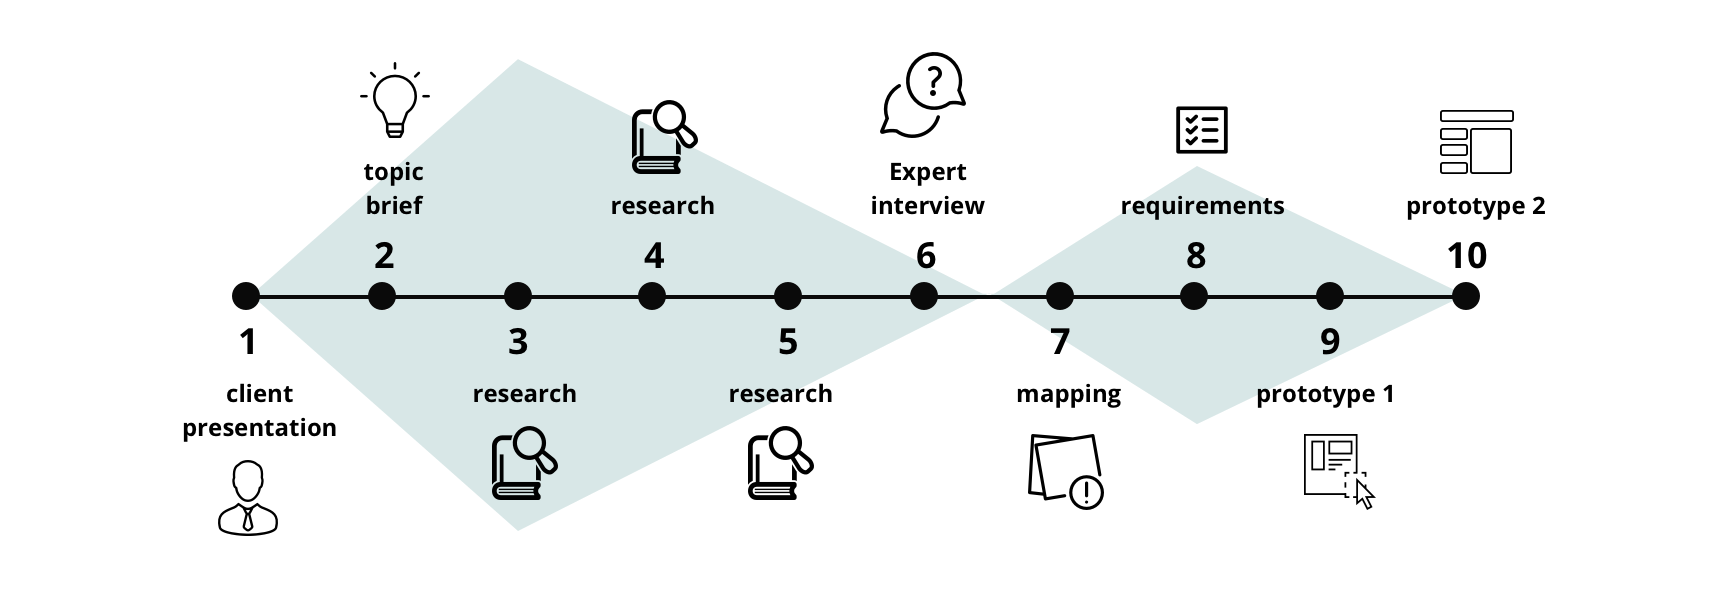
Duration: 4 month, 10 meetings
Methods used: Interview, Affinity Mapping, Moscow, Usability Testing, Flowchart, Wireframes,Prototyping
Tools: Figma, Miro.
Context
The project came up in the course of Experts in Teamwork, which was intended to teach people from different backgrounds, both culturally as professionally, to work together. This project deals with fire on an autonomous ship. Specifically, the visualization of three different levels of fire and the information flow analysis from the system on an autonomous ship. There has been a desire from the industry in several sectors that students who come into work need more cross-disciplinary expertise.
Process
In this project, numerous research methods were used to gather a comprehensive understanding of our two clients' challenges, namely those of Telenor and Yara Birkeland. By using a triangulation of methods, such as individual, quantitative research, expert interviews, and affinity diagramming enough insight were able to get into the research fields to identify and define a challenging research question: How to visualize the scope and spread of fire on an autonomous ship to improve communication? Then, based on our research, we created a set of specific, technical requirements and designed a conceptual human-machine interface that solved the research question in a way that would be feasible, viable, and desirable to the end-users: the human operators in the remote control center.
1. Research
The project started by finding a topic within the topic of autonomous ships. Therefore autonomy had to be understood by us as the industry intending it. In the DNV Report, we learned that the autonomy and remote operation of vessels is still an immature field where new ideas and technical solutions are being constantly introduced. The report declared different levels of autonomy, the project, therefore, focused on the 'Self Controlled' autonomy.
An autonomous ship is not a typical situation. There would not be any people and thus no one to physically confirm the validity of the fire. There would have to be a sufficient amount of data sent to the operator in the remote control center, good enough that he might as well have been physically present.
Due to the complexity of the topic, we needed expert insights. By interviewing multiple experts, triangulation was used to gather insights from different fields. A semi-rigid structure was prepared with questions based on the preliminary research. Also, each group member had assigned roles, so two were taking turns asking questions and the rest took notes.

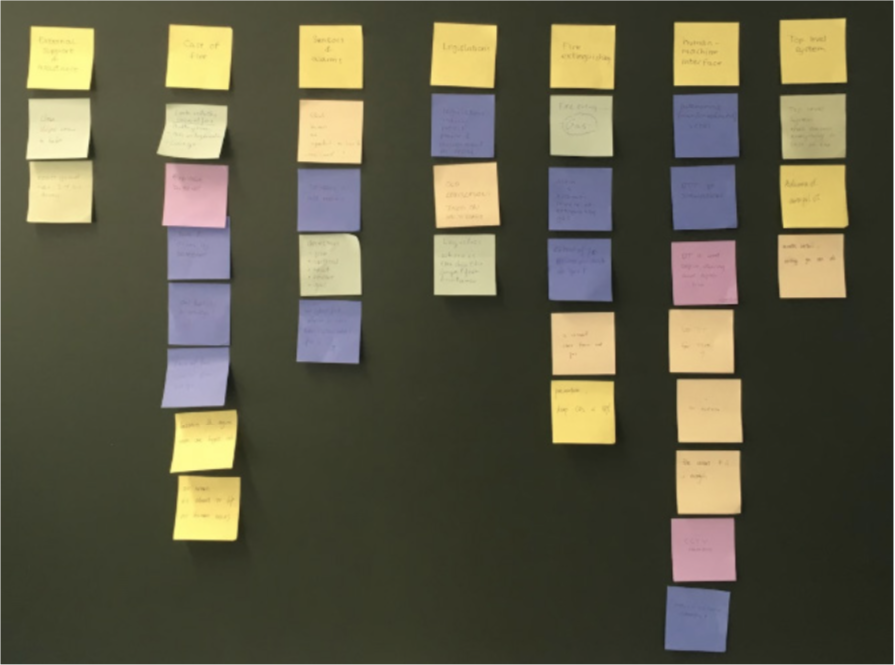
to look for interesting patterns, by having an individual session where everyone wrote their key findings and interesting facts on a post-it we could find themes and eventually define concept requirements.
2. Define
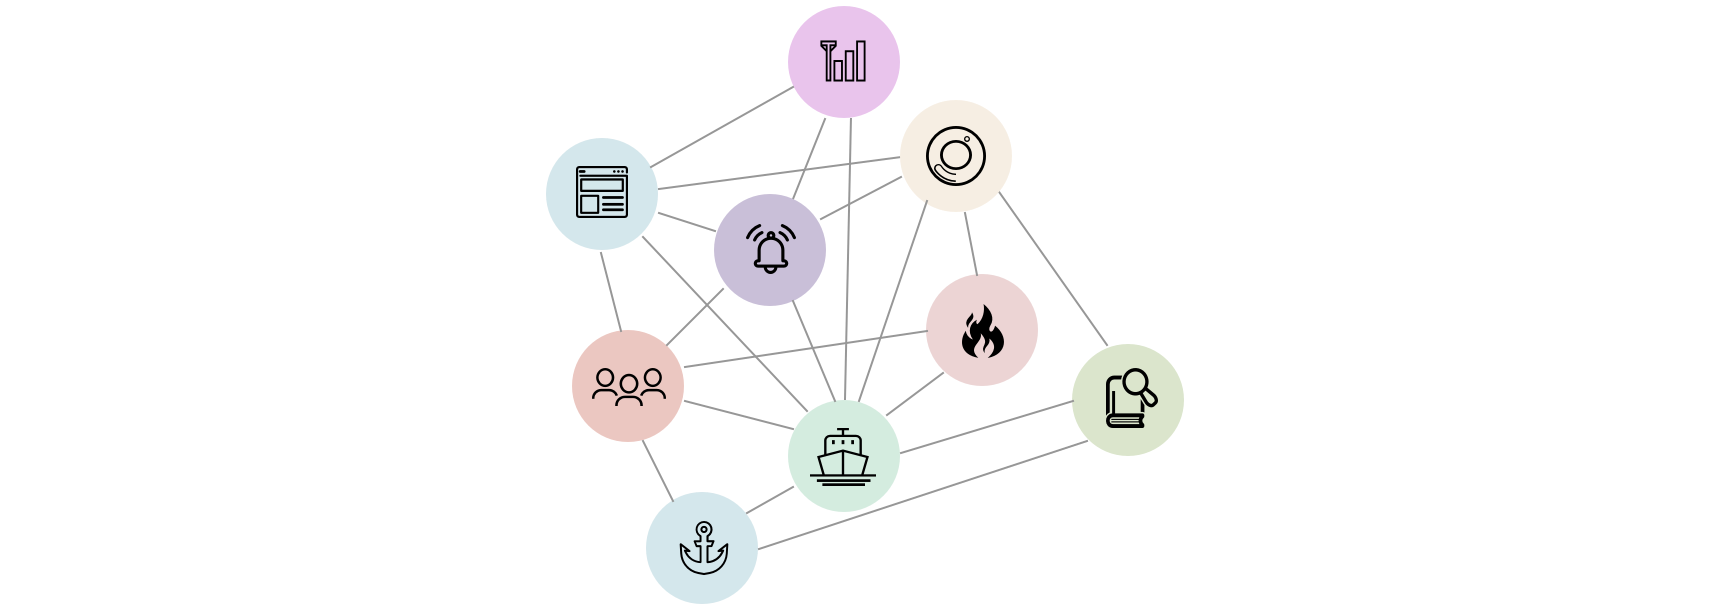
After reaching out, finding key information about the very complex topic of autonomy and emergency situations, more specifically fire outbreaks, it now has to be narrowed down. Consequently, a synthesis of our research was created into a framework. This visual representation of a system led us to synthesize and visualize the insight we had gathered from both research and interviews. It helped us to see the very important relationships.
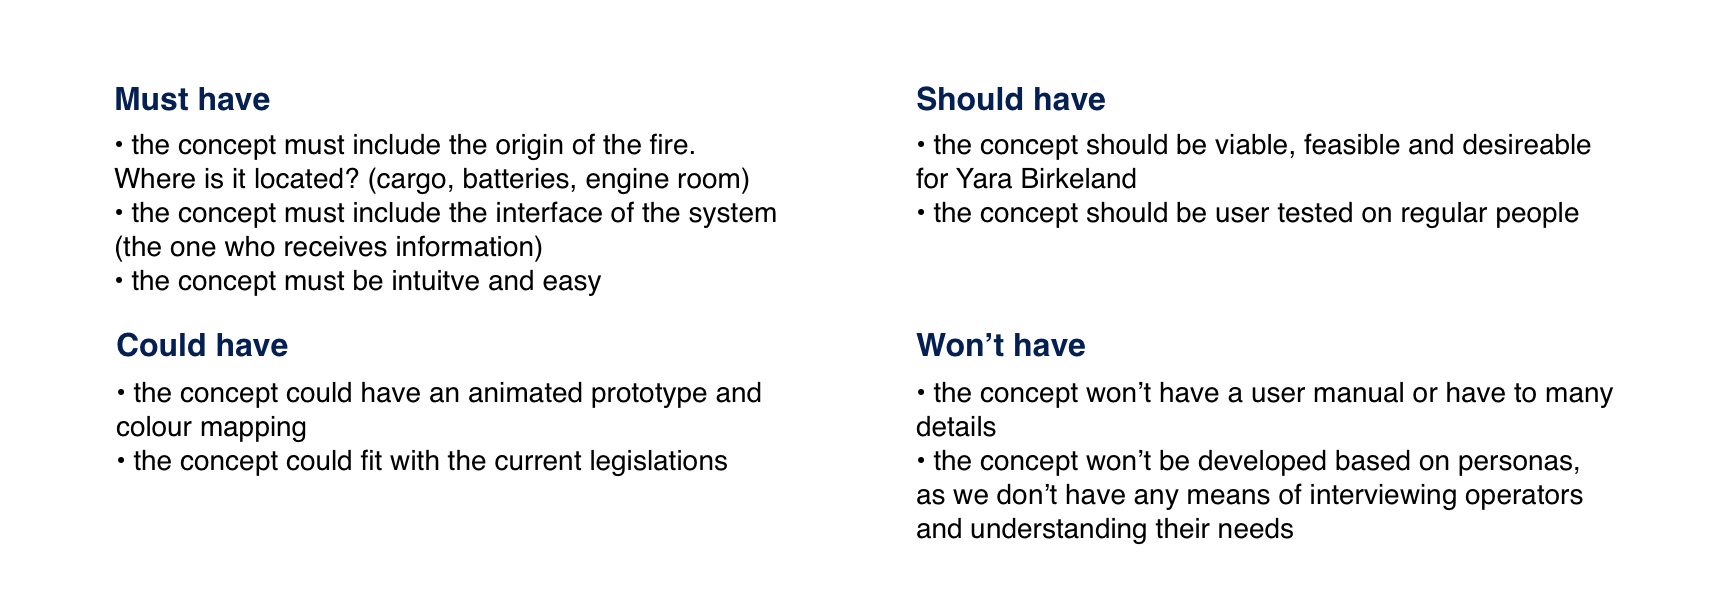
Based on our research, it was clear that we had to define a set of requirements, so our solution would fulfill technical requirements intuitively. We used the MoSCoW method to define the concept requirements. The abbreviation helps the team members to get on the same page, for later systematic planning and managing of the concept.
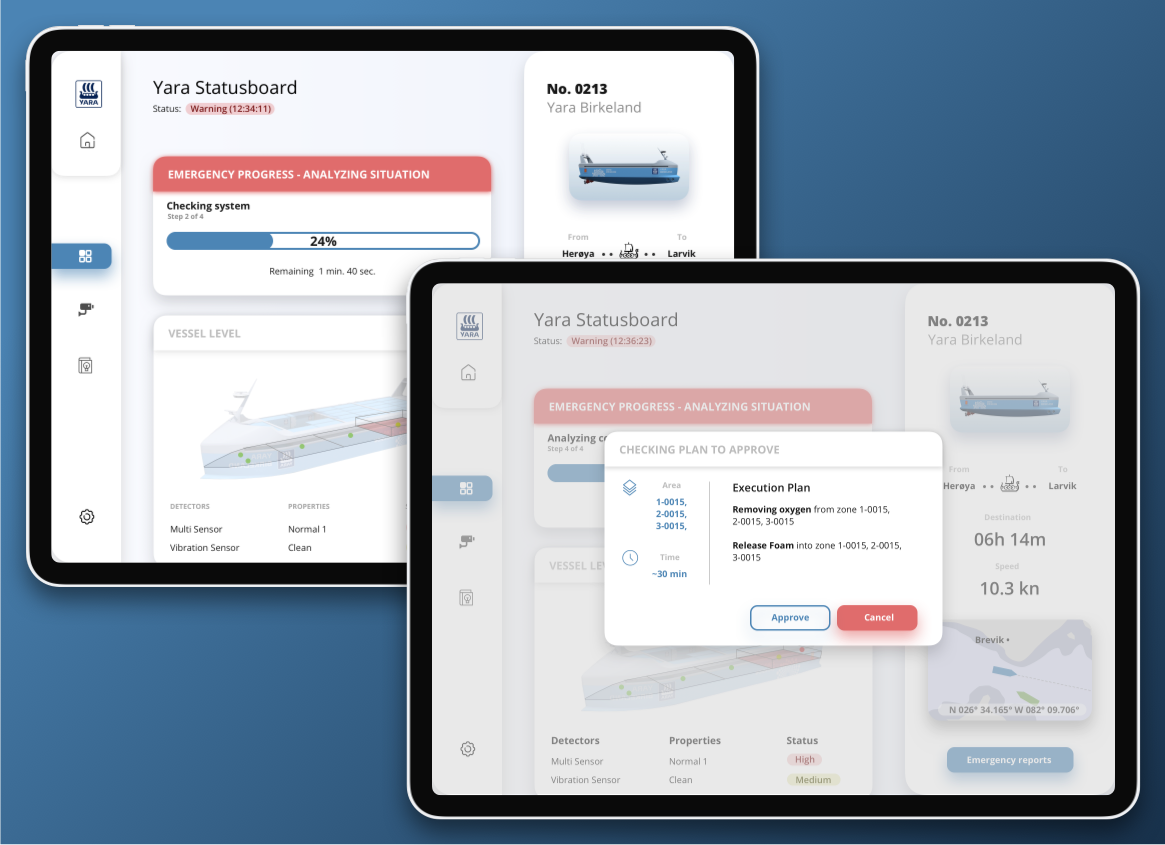
The chosen colors for the three performance states of the system are based upon the report about autonomous vessels from DNV. The colors are intended to be an intuitive way of showing the current state of the system in which green optimal and red is critical. In case of emergency, e.g. with the condition red, the problem needs to be solved as soon as possible to get back to yellow or green before the ship can continue its intended purpose.
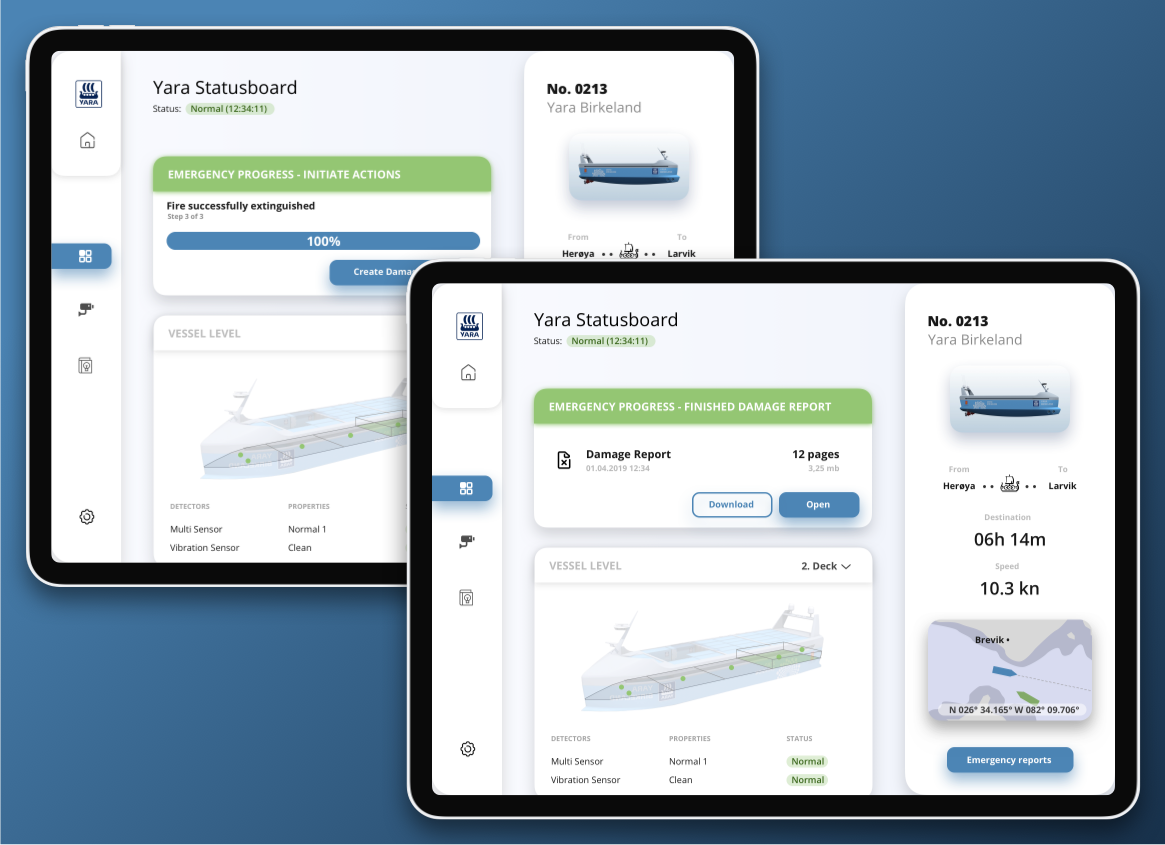
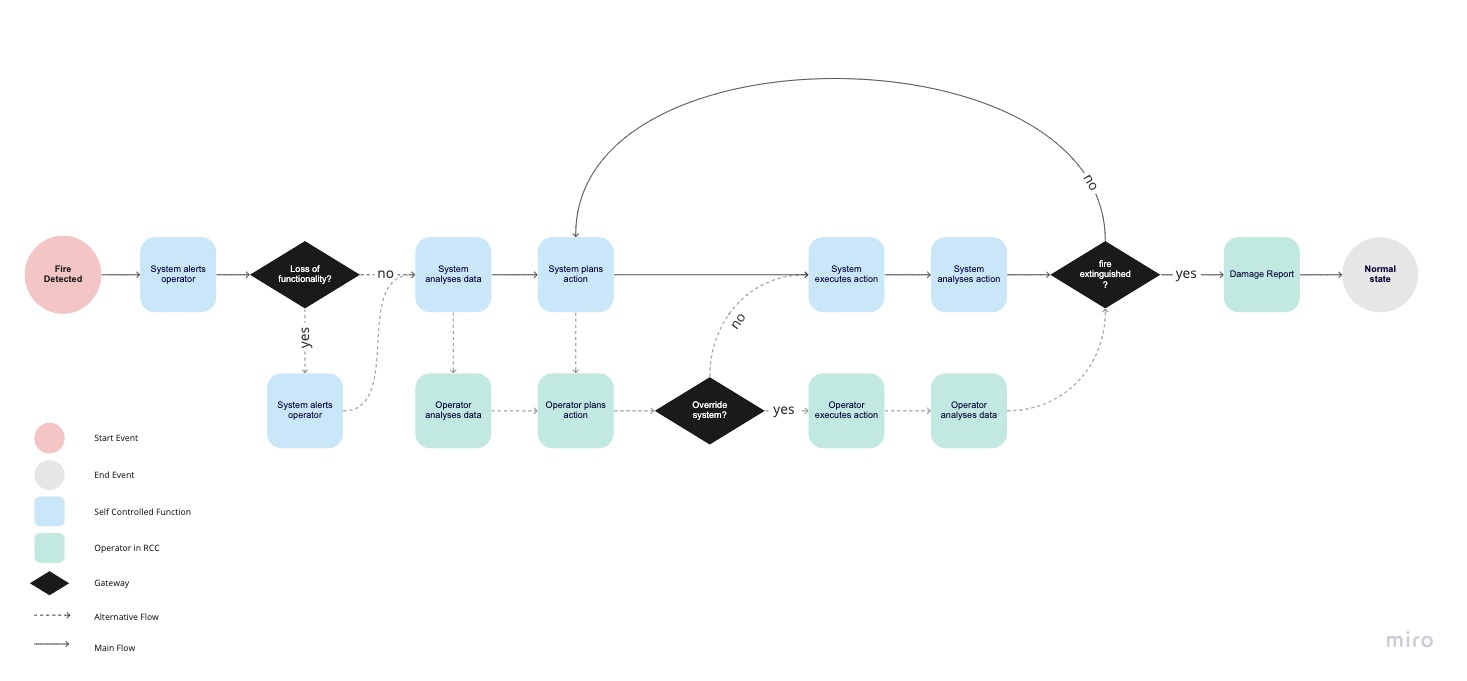
Bringing our research together, certain actions have to be made when a fire breaks out on an autonomous ship. These actions had been put together into a flowchart, to present the procedure of the fire emergency and thus the involvement of the visualization within it. The system can start the sequence until completed without getting any input from humans. They are involved in the fact that the operator gets notified of the problems and planned actions. The operator can overrule the chosen path of the system and manually provide a different action plan.
4. Prototype
The Interface should represent all important data that is necessary for Yara to be able to follow and interact with the autonomous vessel. The main resources for the design process are the flowchart, interviews, and the DNV report which gave the authors a good understanding of how things are working and how processes around the ship will be conducted. That lead to a first wireframe in Figma.
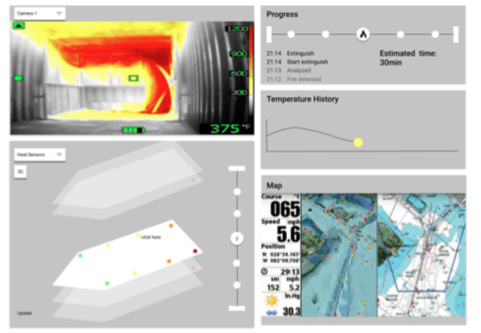
Even though we noticed that the wireframes showed some fundamental logical flaws at this point, we conducted informal user testing because of time issues. Our testers were students to mainly test the information visualization of our concept. Not everything was intuitive, some parts were a bit confusing like a nonconsistent wording of the sensor log and other missing information.
5. Iterate
After our first evaluation, major changes were made. Changes in the colors, fonts, and spacing were added or adjusted. The prototype was enhanced by showing different screens of tiles such as the screen for all cameras or the new look of the sensor log.
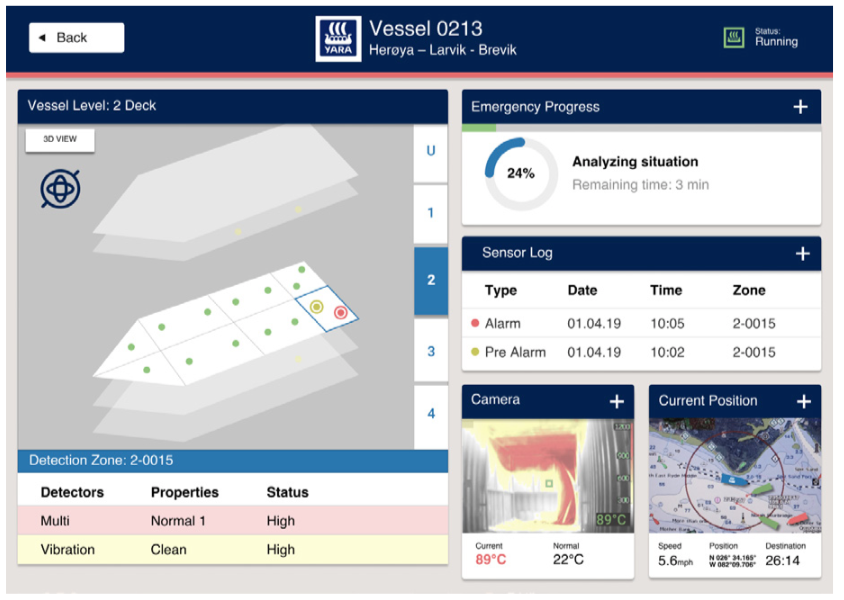
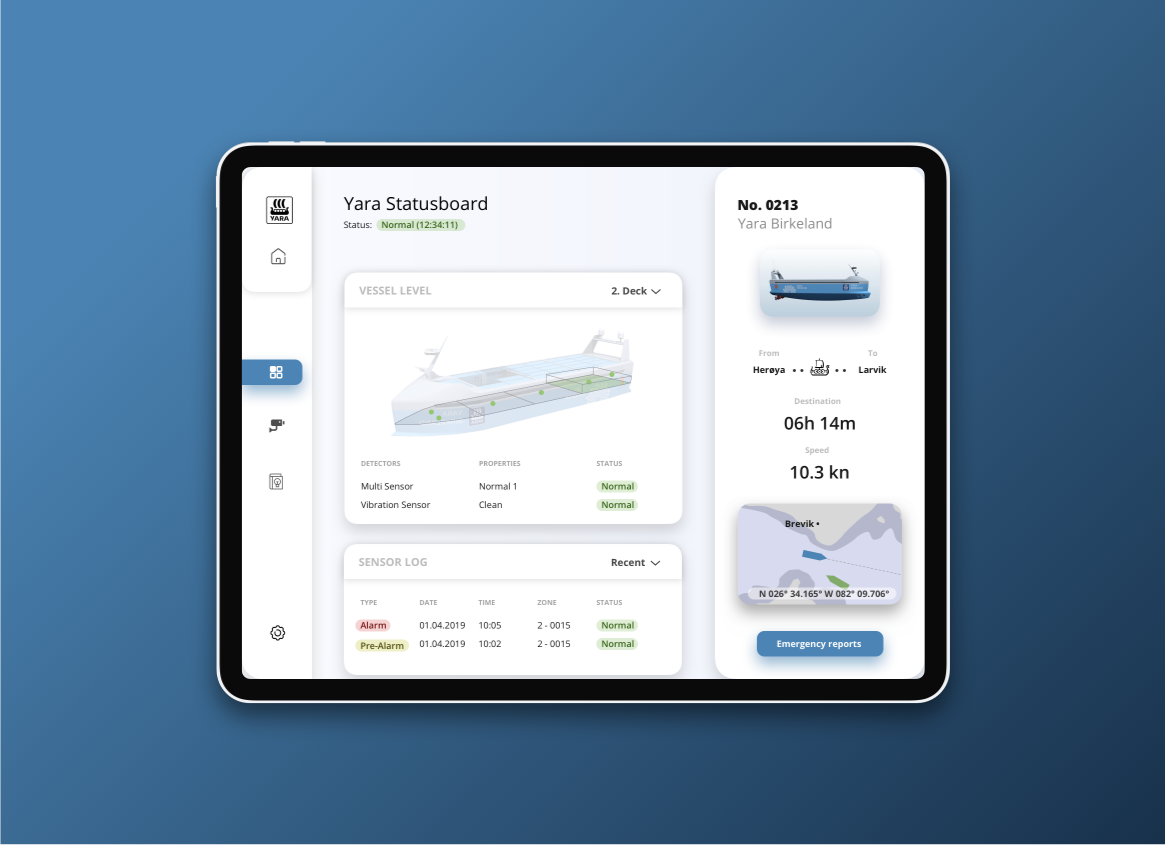
Statusboard - concept
Since the whole project was effectively just 10 meetings long and we had many issues, the result was not as finished as I would like it. So that is why I tried to use our second prototype to bring it into a more finished looking mockup. I slightly changed the focus of the information but kept the idea of a dashboard. However, this result has not been tested on users and just represents my personal idea.